- Most healthy individuals and stable hospitalized patients have native preload reserve and will show positive fluid responsiveness on a PLR or dynamic test
- Being “responsive” does not automatically mean a patient needs volume
- The Unified Framework:
- Use Static Indices (physical exam markers, lactate, basic static ultrasound) as a screening tool to establish a high pre-test probability of shock or tissue hypoperfusion
- Once a perfusion deficit is confirmed, deploy Dynamic Science (PLR, EEOT, PPV, or echo stroke volume calculations) to confirm if a fluid bolus will successfully increase cardiac output or if you must switch to early vasoactive medications
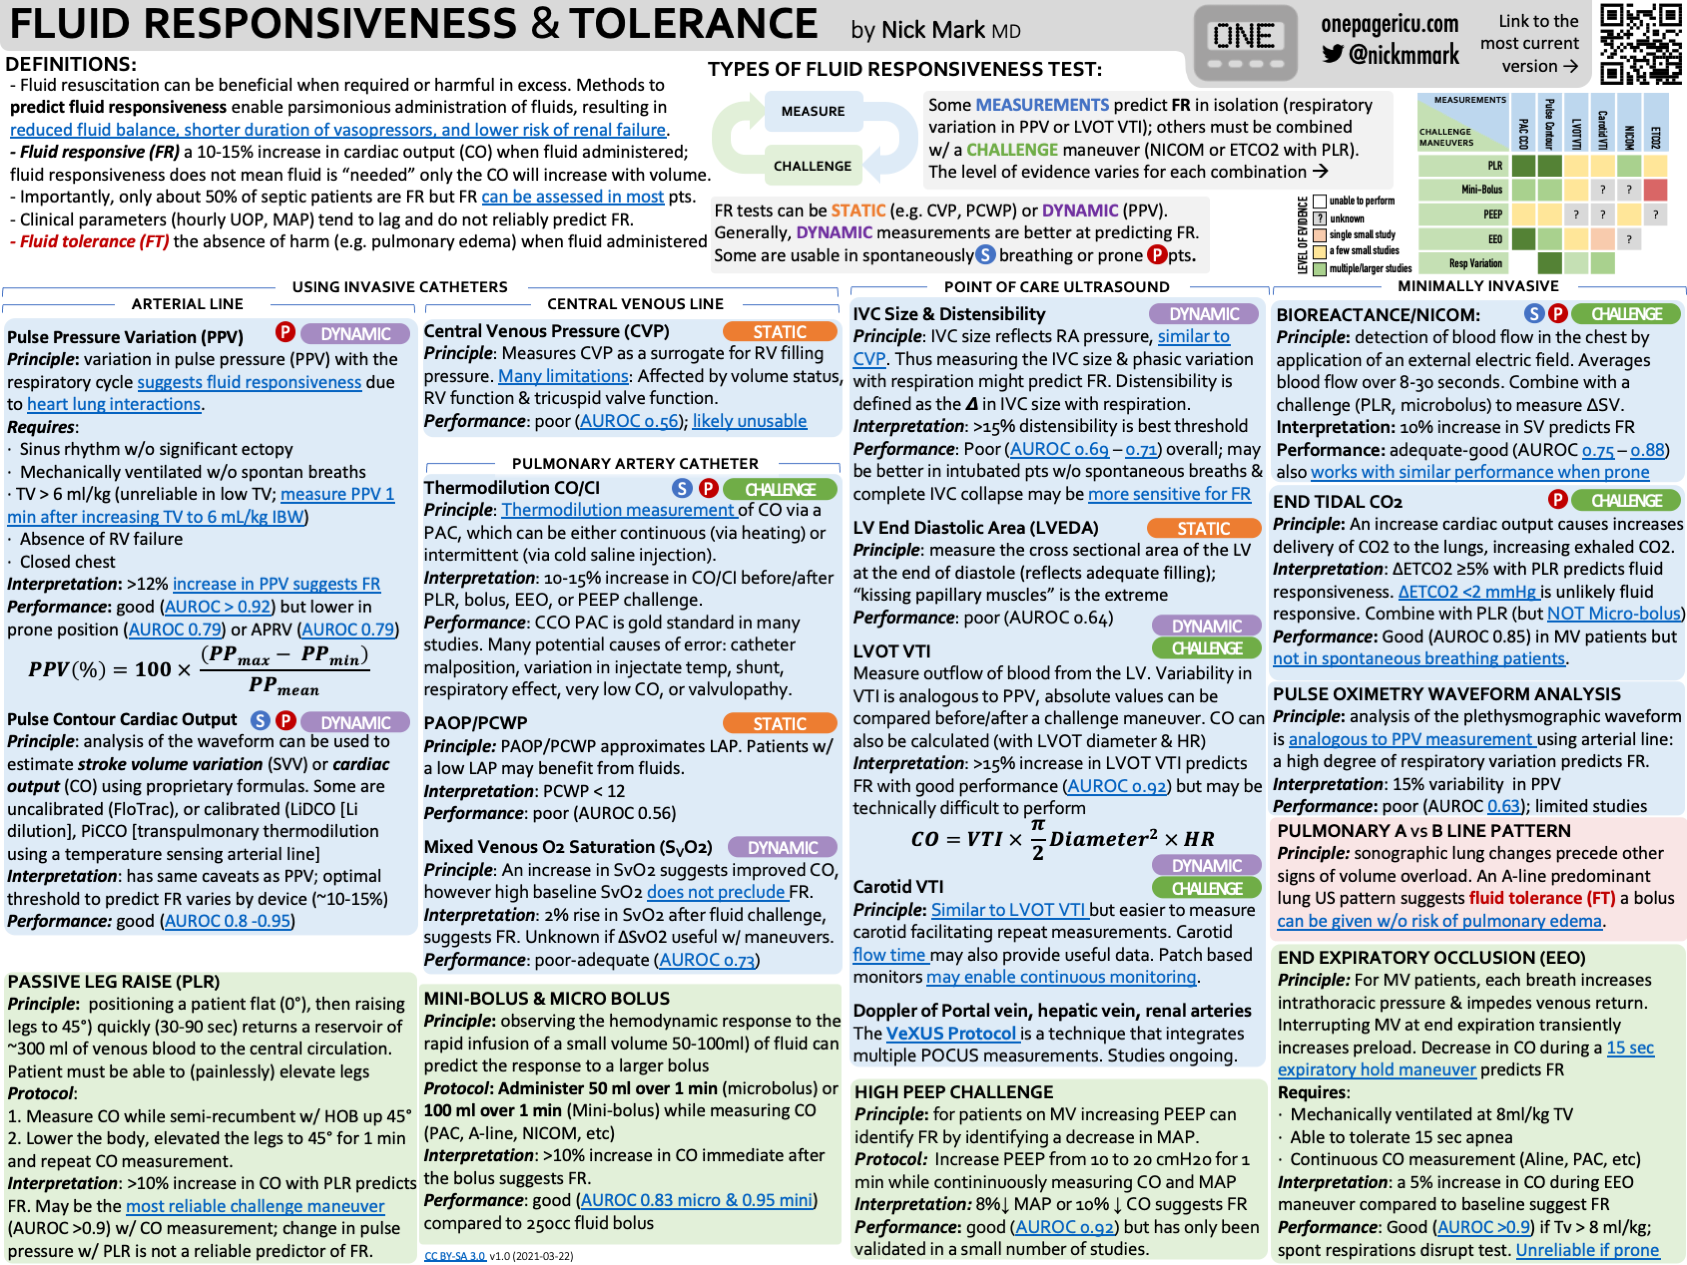
- Fluid responsiveness is 10-15% increase in cardiac output in response to a fluid challenge (500 mL of crystalloid over 10-15 minutes) or pre-load augmentation manoeuvre
- Not the same as needing fluid:
- Is the patient fluid responsive? (Will CO rise with fluid?)
- Does the patient need fluid? (Is tissue perfusion inadequate and likely to improve with more preload?)
- Clinical parameters (e.g. hourly urine output and MAP) tend to lag and do not reliably predict fluid responsiveness
- Do not be part of the blind who determines a patient is fluid responsive (using any of the measures below) and then gives a fluid bolus; does the patient actually get better
Fluid Tolerance
- Fluid tolerance is the absence of harm (e.g. pulmonary oedema) when fluid is administered
Pulmonary A vs B Line Pattern
- Sonographic lung changes precede other signs of volume overload
- An A-line predominant lung US pattern suggests fluid tolerance (see Lung POCUS)
Measures
- There exists dynamic and static measures
- Dynamic measures rely on the respiratory cycle and how it effects changes with cardiac preload buy generally require mechanical ventilation
- Increasing intrathoracic pressure with positive pressure (mechanical ventilation) → ↓ venous return → ↑ RV afterload → ↓ LV filling
- Static measures do not require this
- Dynamic measures rely on the respiratory cycle and how it effects changes with cardiac preload buy generally require mechanical ventilation
- Generally dynamic predictors are better than static predictors (e.g. CVP[^2], PCWP, RAP/LVEDP)
- Some measures can predict fluid responsiveness in isolation but some need to be combined with a challenge; with the level of evidence varying for each combination (see ICU one pager top right)
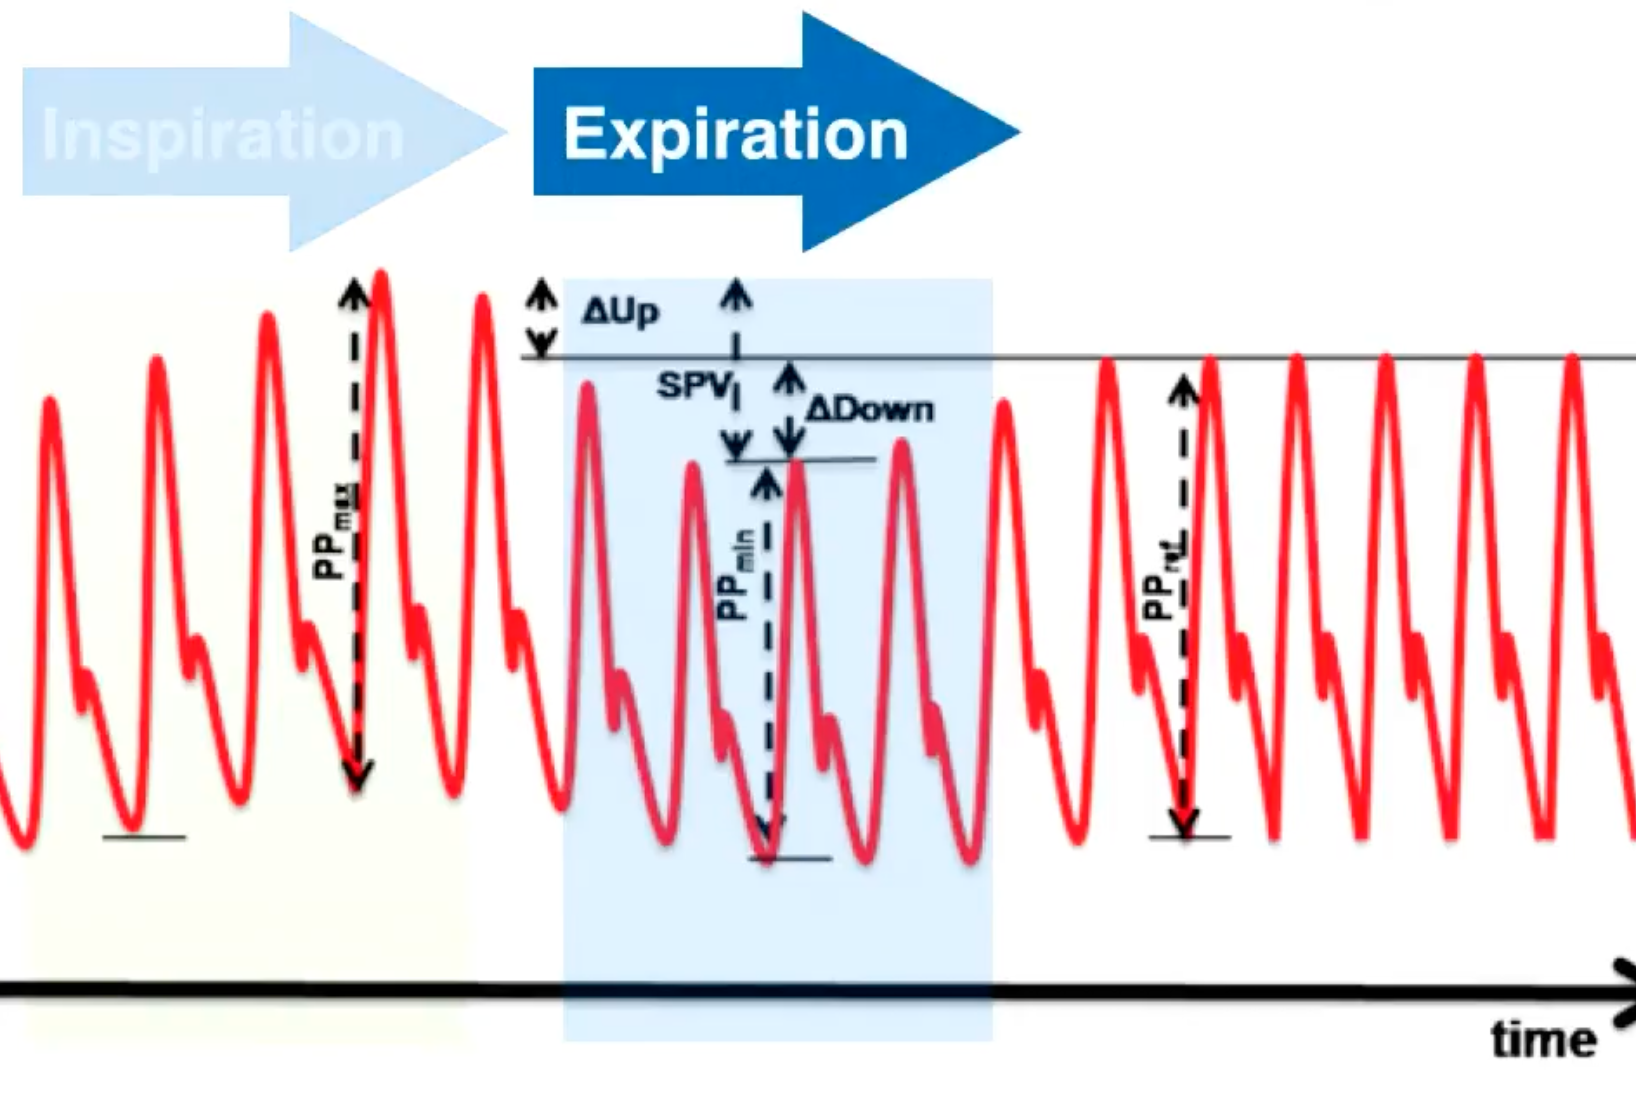
Pulse Pressure Variation
- Swing of the A-line
- Requirements
- Sinus rhythm without significant ectopy
- Normal abdominal pressure
- No RV dysfunction
- Synchronous with the ventilator (mechanically ventilated without spontaneous breaths)
- Receiving 8mL/kg of tidal volume
- PEEP of 5-10 cm of
- Closed chest (open chest post-cardiotomy invalidates)
- PPV > 12% means the patient is probably fluid responsive
Pulse Contour Cardiac Output
- Computer does uses some proprietary formulas to analyse the waveform of the arterial line to estimate stroke volume variation or cardiac output (e.g. FloTrac, LiDCO, PiCCO)
- Can be performed in spontaneously breathing patients
- Optimal threshold to predict fluid responsiveness varies by device but generally good predictor
Thermodilution Measurement of Cardiac Output or Index
- Pulmonary artery catheter used to inject cold saline proximally and measure temperature distally. Formulas are then used to calculate the amount of blood required to dilute the cold bolus based on the temperature to figure out cardiac output and index
- A 10-15% increase in cardiac output/index before & after a challenge
- Considered the gold standard but limited by potential causes of error:
- Catheter malposition
- Variation in injectate temperature
- Shunt
- Very low cardiac output
- Vavlulopathy
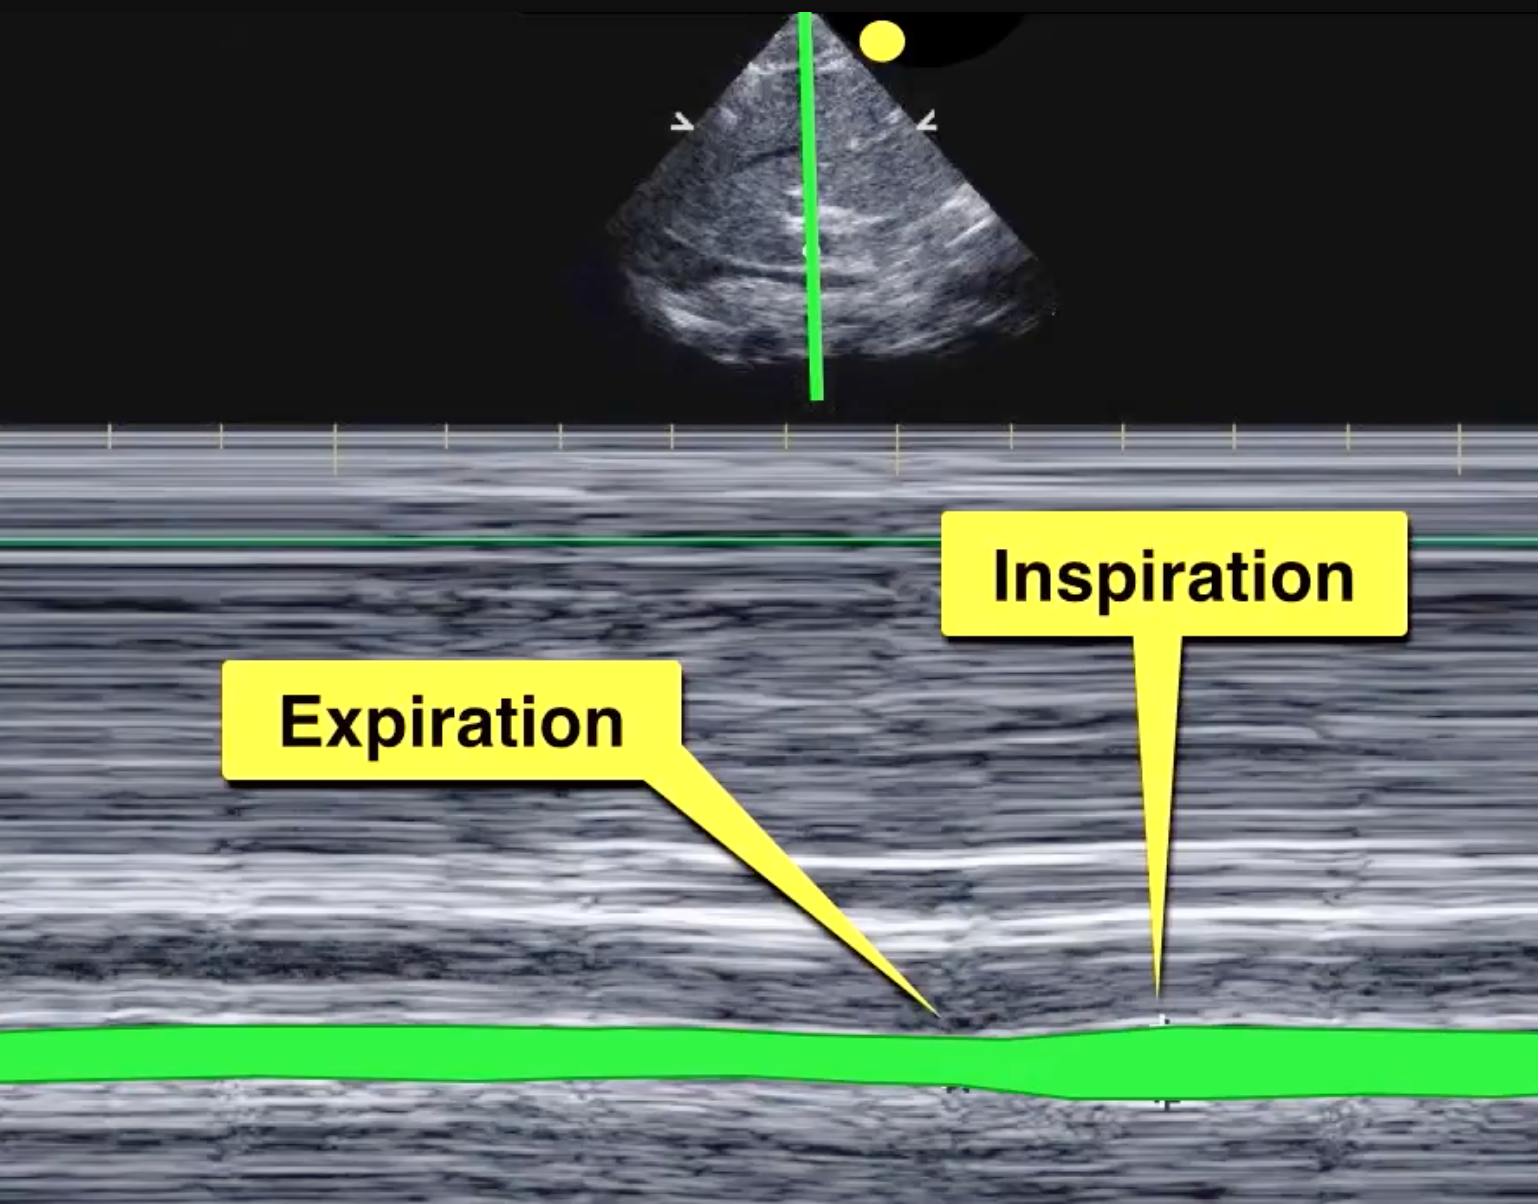
IVC Size & Distensibility Index
- Positive intrathoracic pressure during inhalation (mechanical ventilation) causes IVC to become larger and on releasing, IVC returns to normal size
- Requirements
- Sinus rhythm
- Normal abdominal pressure
- No RV dysfunction or pulmonary hypertension
- Synchronous with the ventilator
- Receiving 8mL/kg of tidal volume
- PEEP of 5-10 cm of
- Use a curvilinear or phased arraw probe placed in the subxiphopid area measuring the IVC in long-axis view
- Use M-mode to track the size of the IVC over time at ~2cm caudal to the RA-IVC junction
- In spontaneously breathing patients using the collapsibility index
- Measured in the subxiphoid view
- Collapsibility > 50% suggests fluid responsiveness
- Collapsibility <15-20% suggests volume overload/non-responsiveness
- IVC < 2.1 cm with > 50% collapsibility suggests relative hypovolaemia
- IVC > 2.1 cm with < 50% collapsibility suggests volume overload or high right sided pressures
- In mechanically ventilating patients use the distensibility index
- Distensibility >18% predicts fluid responsiveness
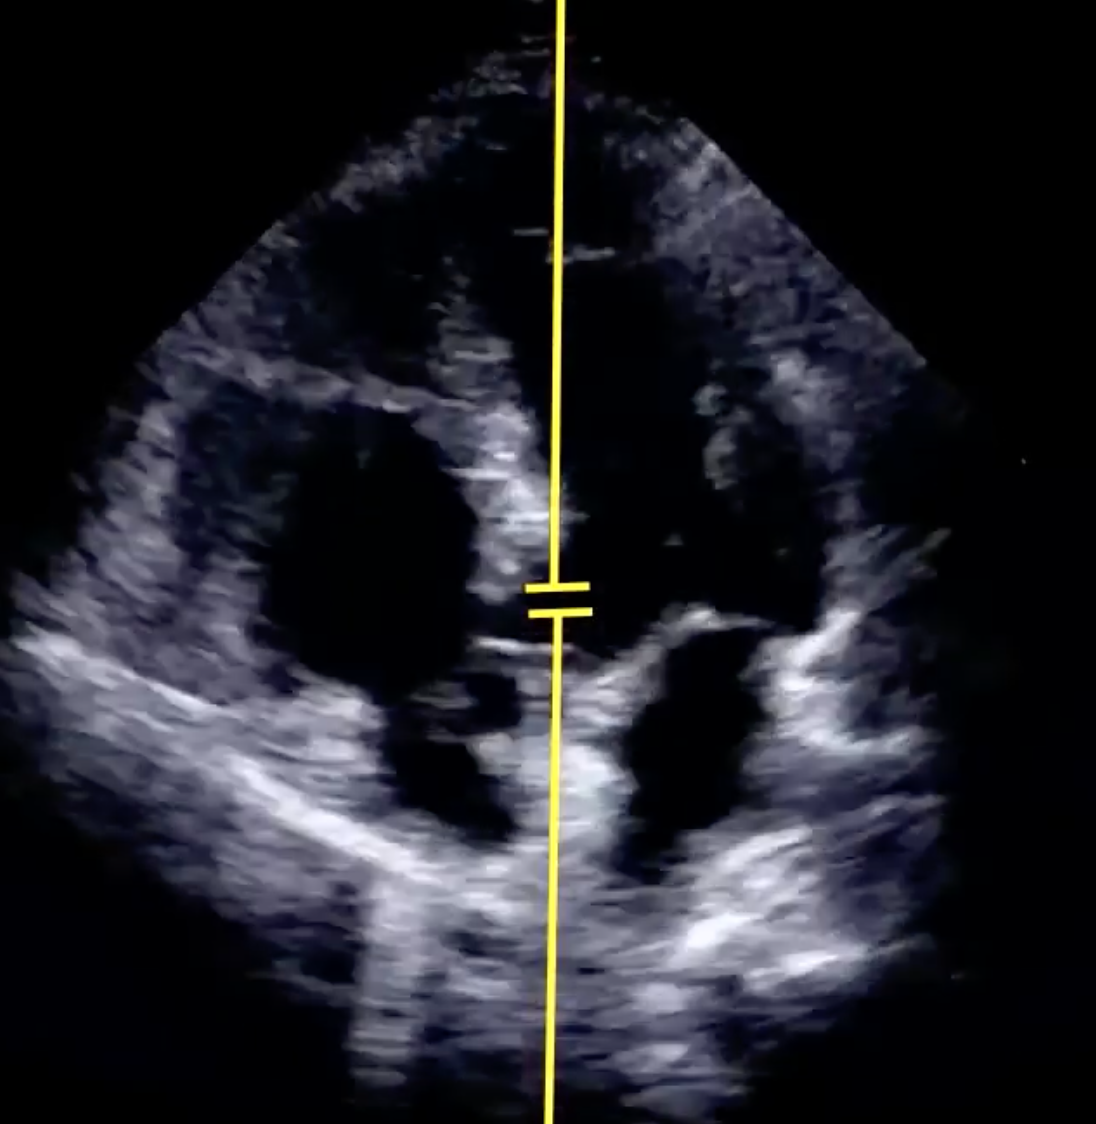
Sub-Aortic Peak Velocity
-
Obtain a apical 5 chamber view (4-chamber view tilted anteriorly to see the LVOT)
-
Requirements
- Sinus rhythm
- Normal abdominal pressure
- No RV dysfunction
- Synchronous with the ventilator
- Receiving 8mL/kg of tidal volume
- PEEP of 5-10 cm of
-
Place a pulse wave doppler in the LVOT
-
Review peak velocity difference between highest and minimum
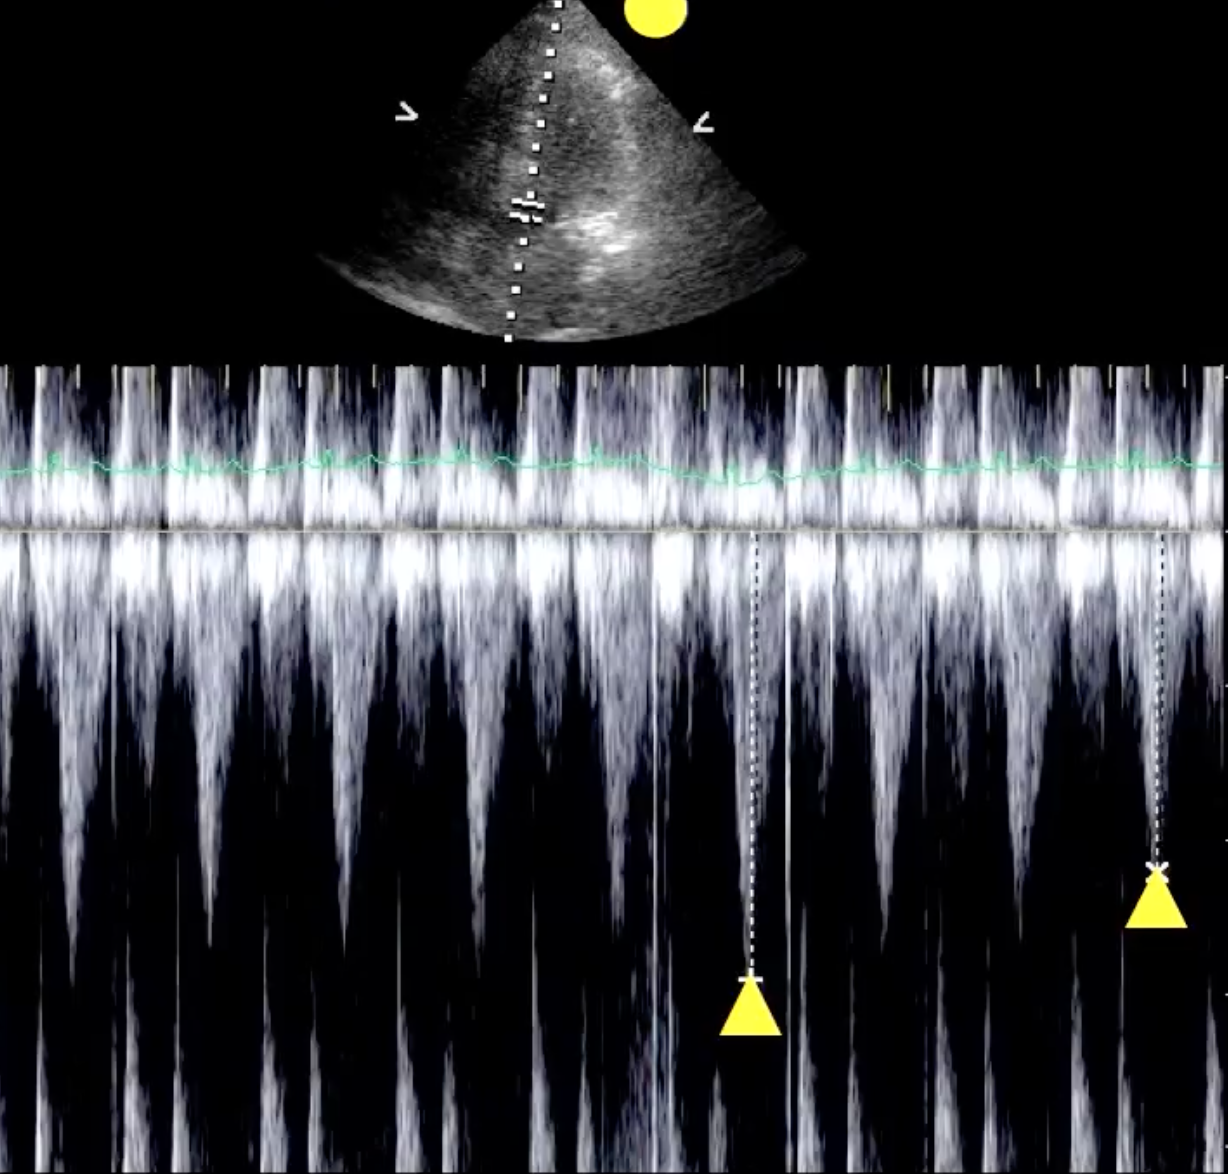
- More than 12% predicts fluid responsiveness
LVOT VTI
- Conceptual framework
- The Left Ventricular Outflow Tract (LVOT) is modeled as a geometric cylinder
- The volume of blood propelled through this cylinder during a single systole represents one Stroke Volume (SV)
- To determine the volume of this cylinder, the clinician must solve for two metrics: the width (diameter) of the cylinder and the height (stroke distance) of the blood column
- Measure cylinder width (LVOT diameter)
- Freeze the ultrasound frame precisely at mid-systole when the aortic valve leaflets are completely open
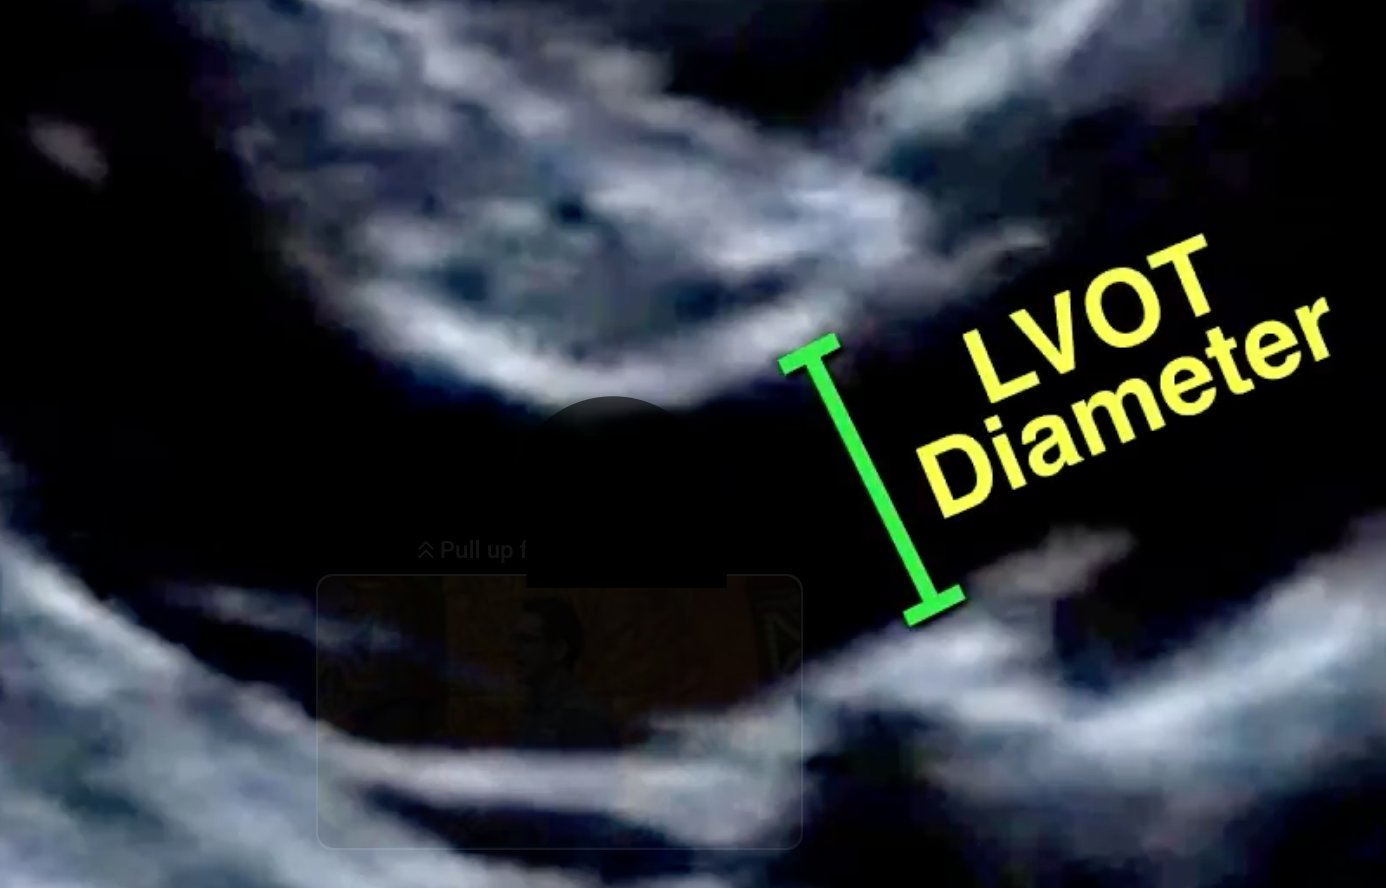
- Zoom in specifically on the LVOT area to optimise spatial resolution
- Carefully measure the diameter of the LVOT from the white inner edge to the opposite white inner edge (inner-to-inner border), parallel to the aortic valve plane
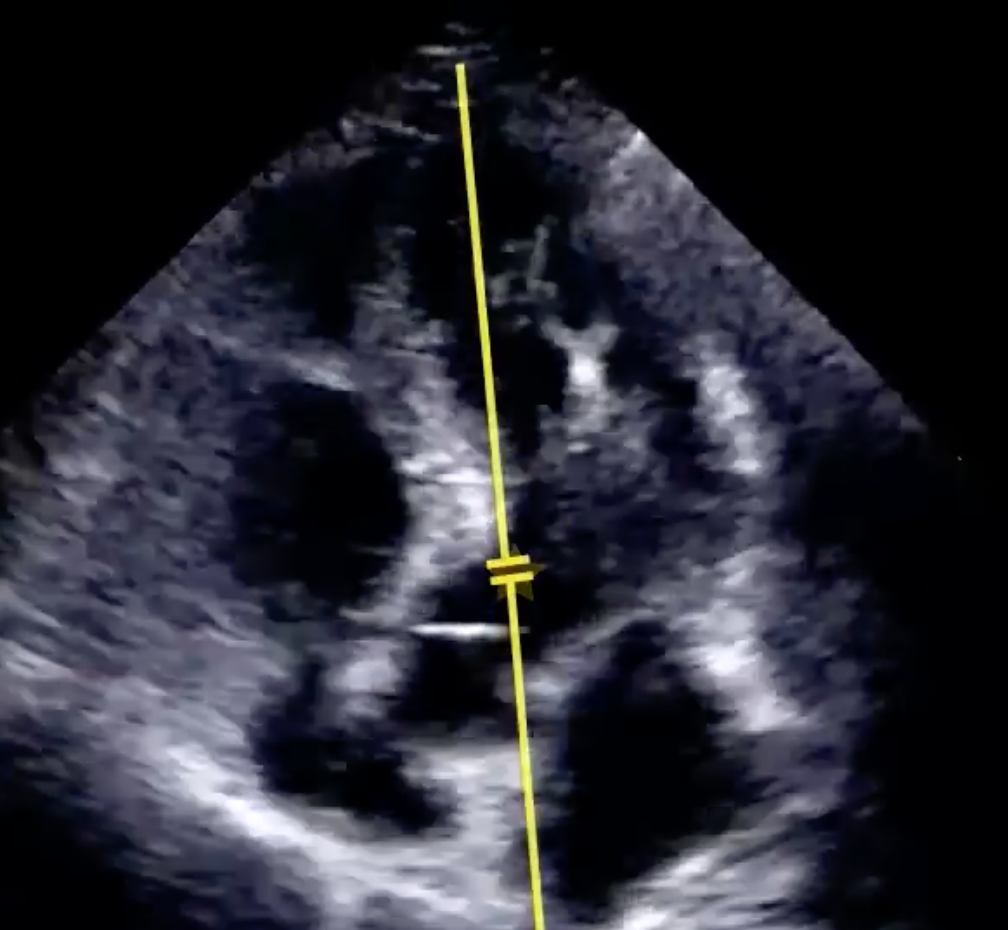
- Measure cylinder height (stroke distance via VIT)
- Obtain an apical 5 chamber view
- Activate Pulse Wave (PW) Doppler and position the sample gate within the LVOT, just proximal to the aortic valve annulus
- Obtain a clean spectral Doppler tracing
- This will display a series of inverted, envelope-like waveforms reflecting blood flowing away from the probe
- Caliper-trace the perimeter of these waveforms across a few cardiac cycles (not some machines can do auto VTI tracing and calculate the LVOT VTI for you); normal VTI measurement is 18-22 cm
- LVOT VTI < 18cm suggests reduced cardiac output shock (e.g. cardiogenic, obstructive, hypovolaemic)
- LVOT VTI ≥18cm suggests normal or increased cardiac output (e.g. early distributive or septic shock)
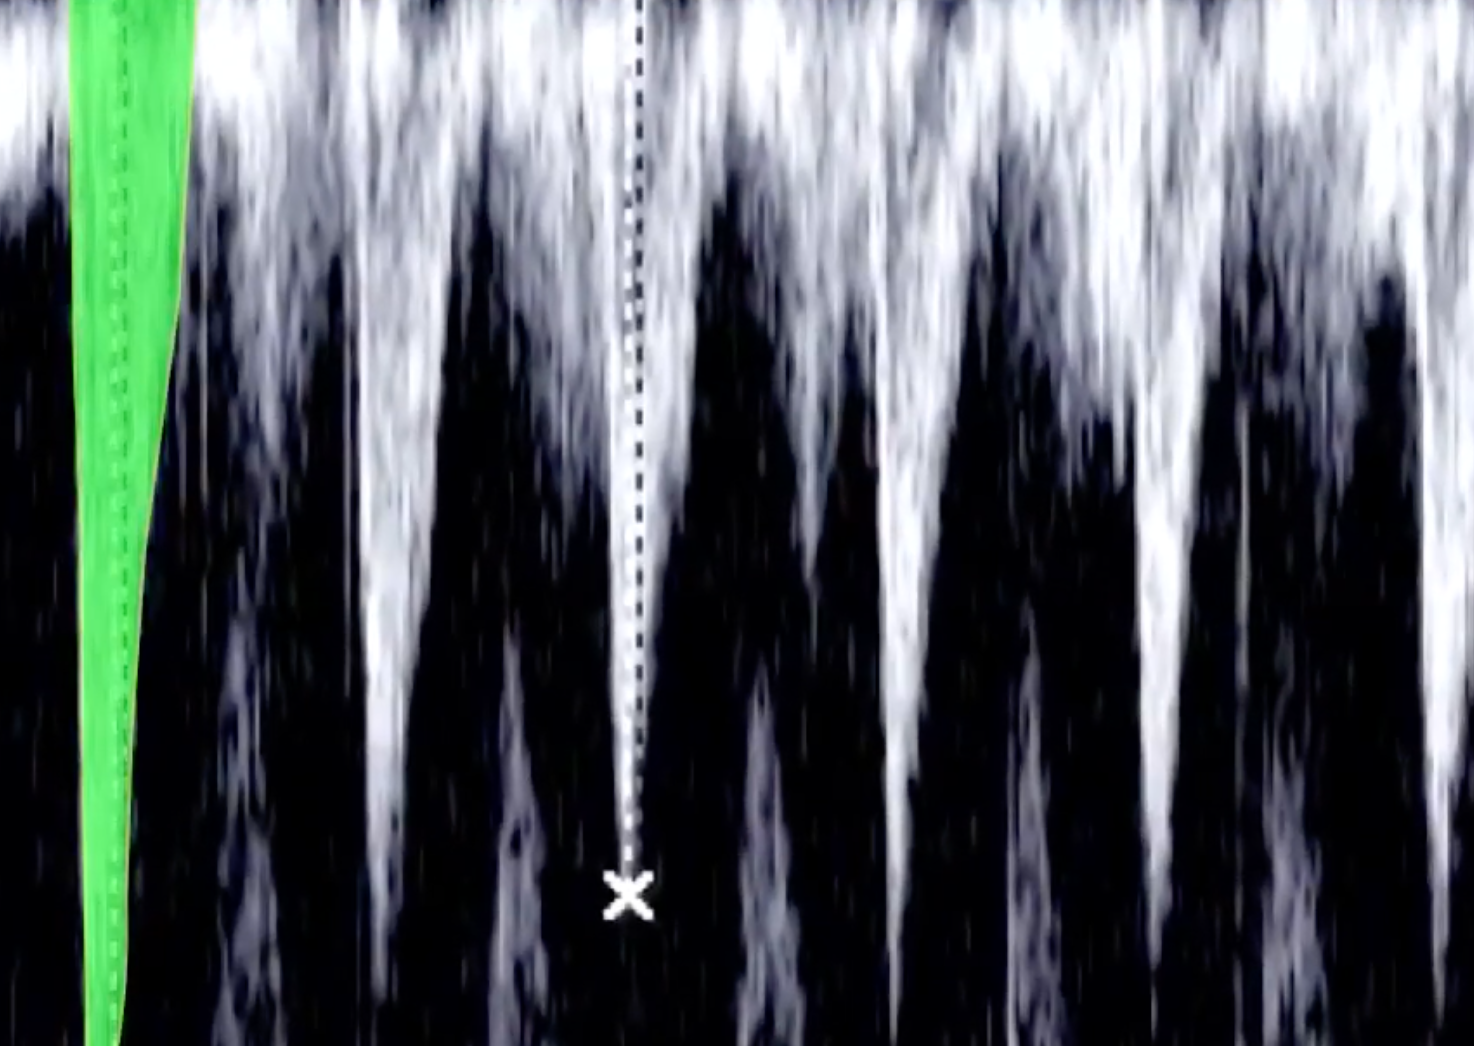
- The ultrasound machine automatically integrates the velocity over time to calculate the Velocity Time Integral (VTI), which is displayed in centimetres
- This represents the total distance the red blood cells travel in one beat (cylinder height)
- Calculation and dynamic application
- Deriving stroke volume using the formula
- Assessing fluid responsiveness:
- Calculate the baseline SV and re-evaluate it during a dynamic manoeuvre like a passive leg raise or a mini fluid challenge
- A ≥ 12% increase in Stroke Volume indicates a positive response, demonstrating that the patient has preload reserve and will tolerate/benefit from fluid resuscitation
- If the increase is < 12%, the patient is on the flat portion of the Frank-Starling curve; withhold fluids and look toward vasopressors or inotropes instead
Carotid VTI
-
Can use a linear probe
-
Find the common carotid artery in short axis view
-
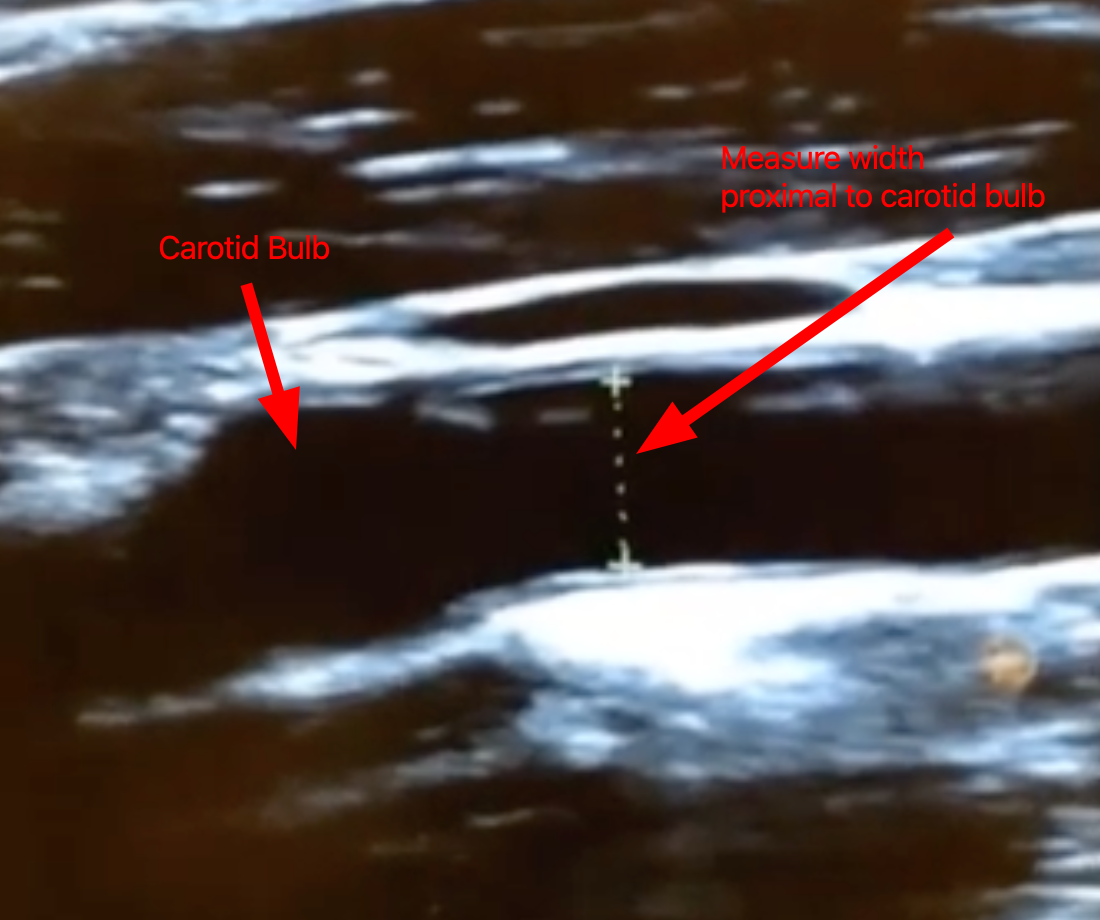
Switch to the long axis view with the widening proximal to the common carotid bifurcation (carotid bulb) in view
-
Find a picture at systole (when the artery is at its widest diameter); freeze the view and scroll through the images
-
Measure the width of the carotid artery within 1cm proximal tot he carotid bulb
-
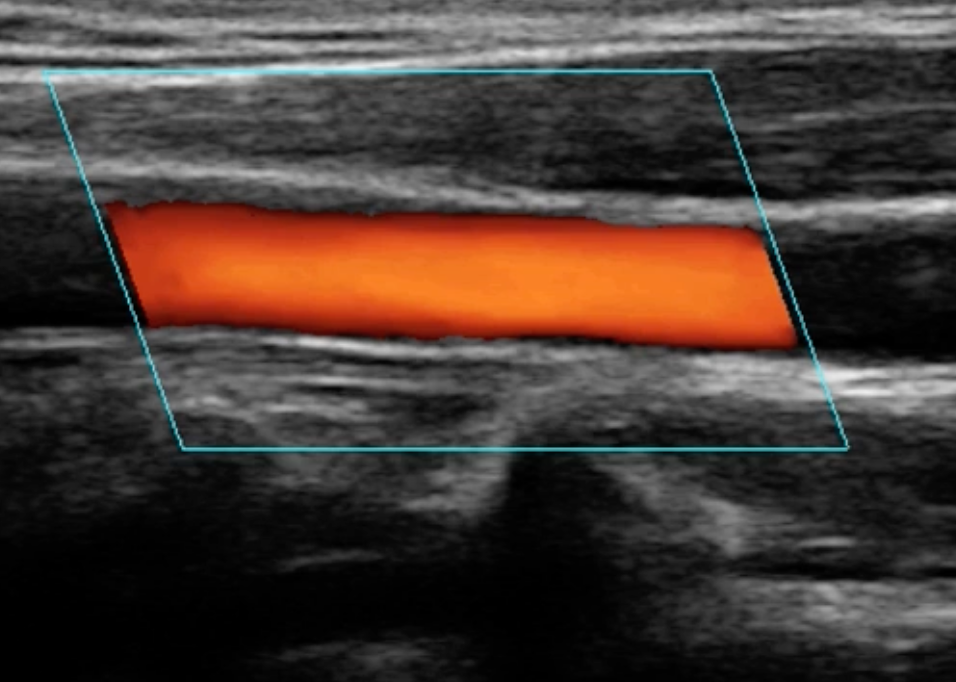
Where there is significant plaque, you can use colour doppler to tell the boundaries of the lumen
-
Place the gate of the pulse wave doppler at the centre of the carotid artery
-
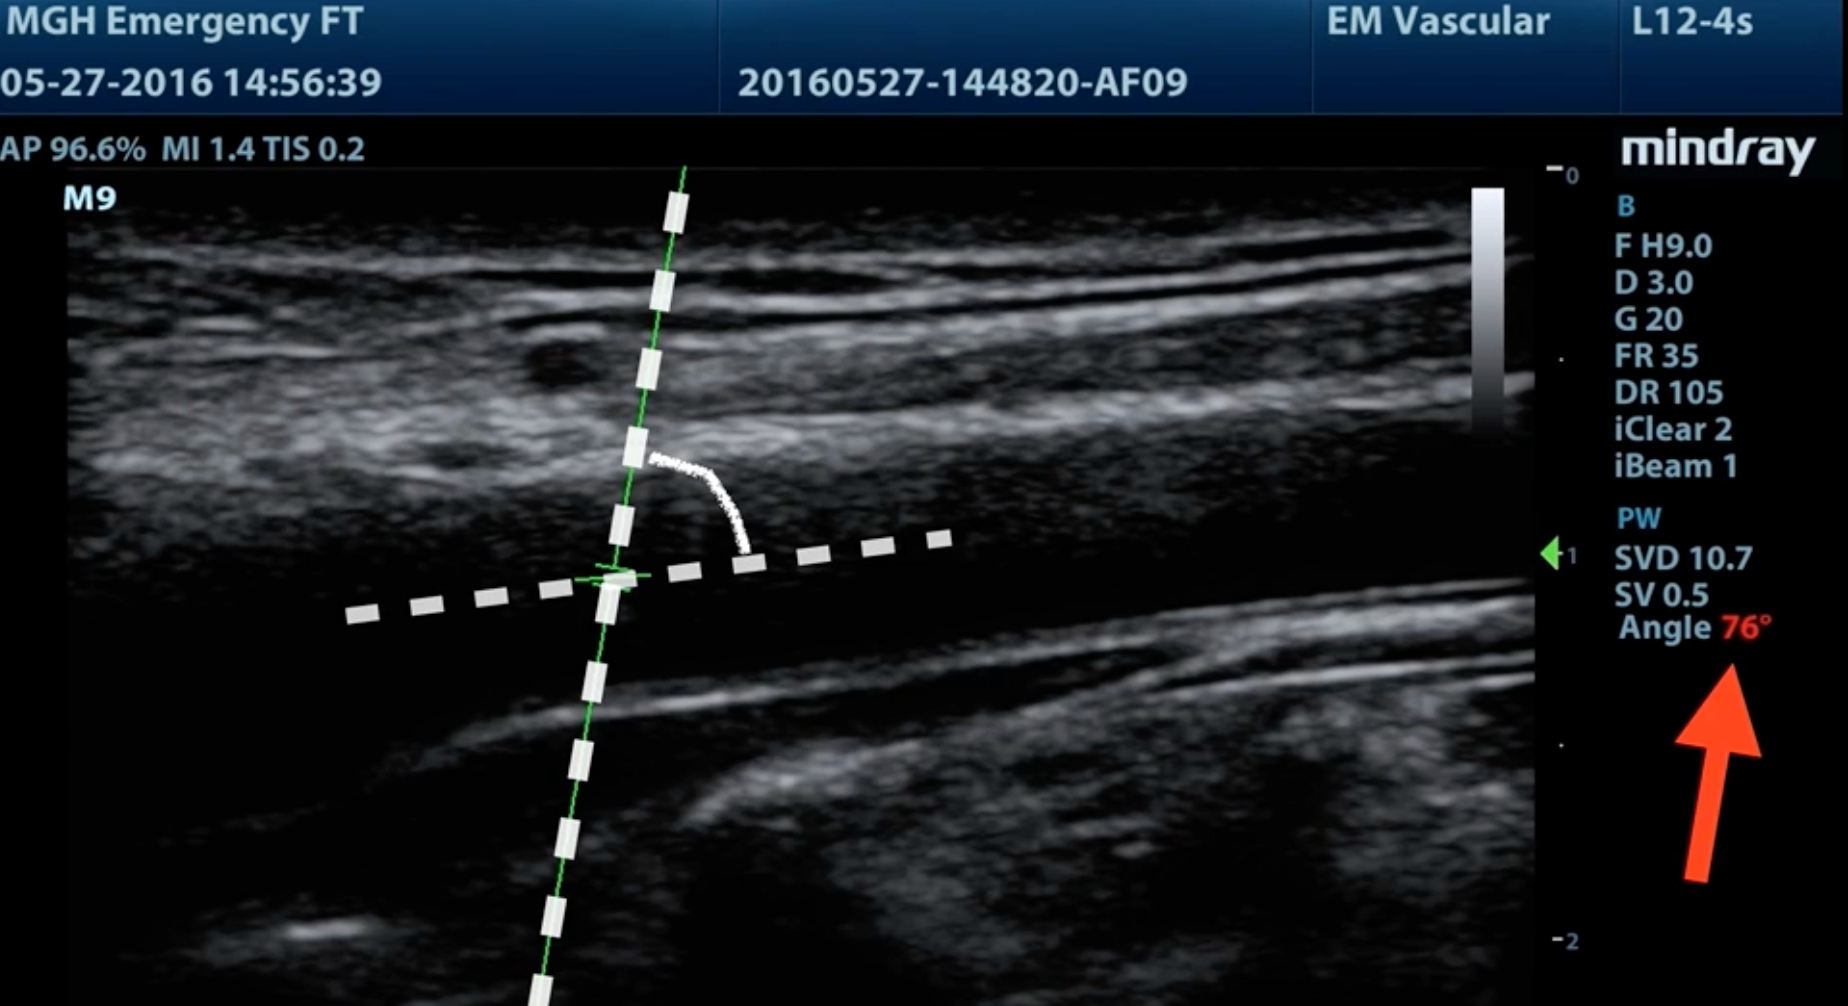
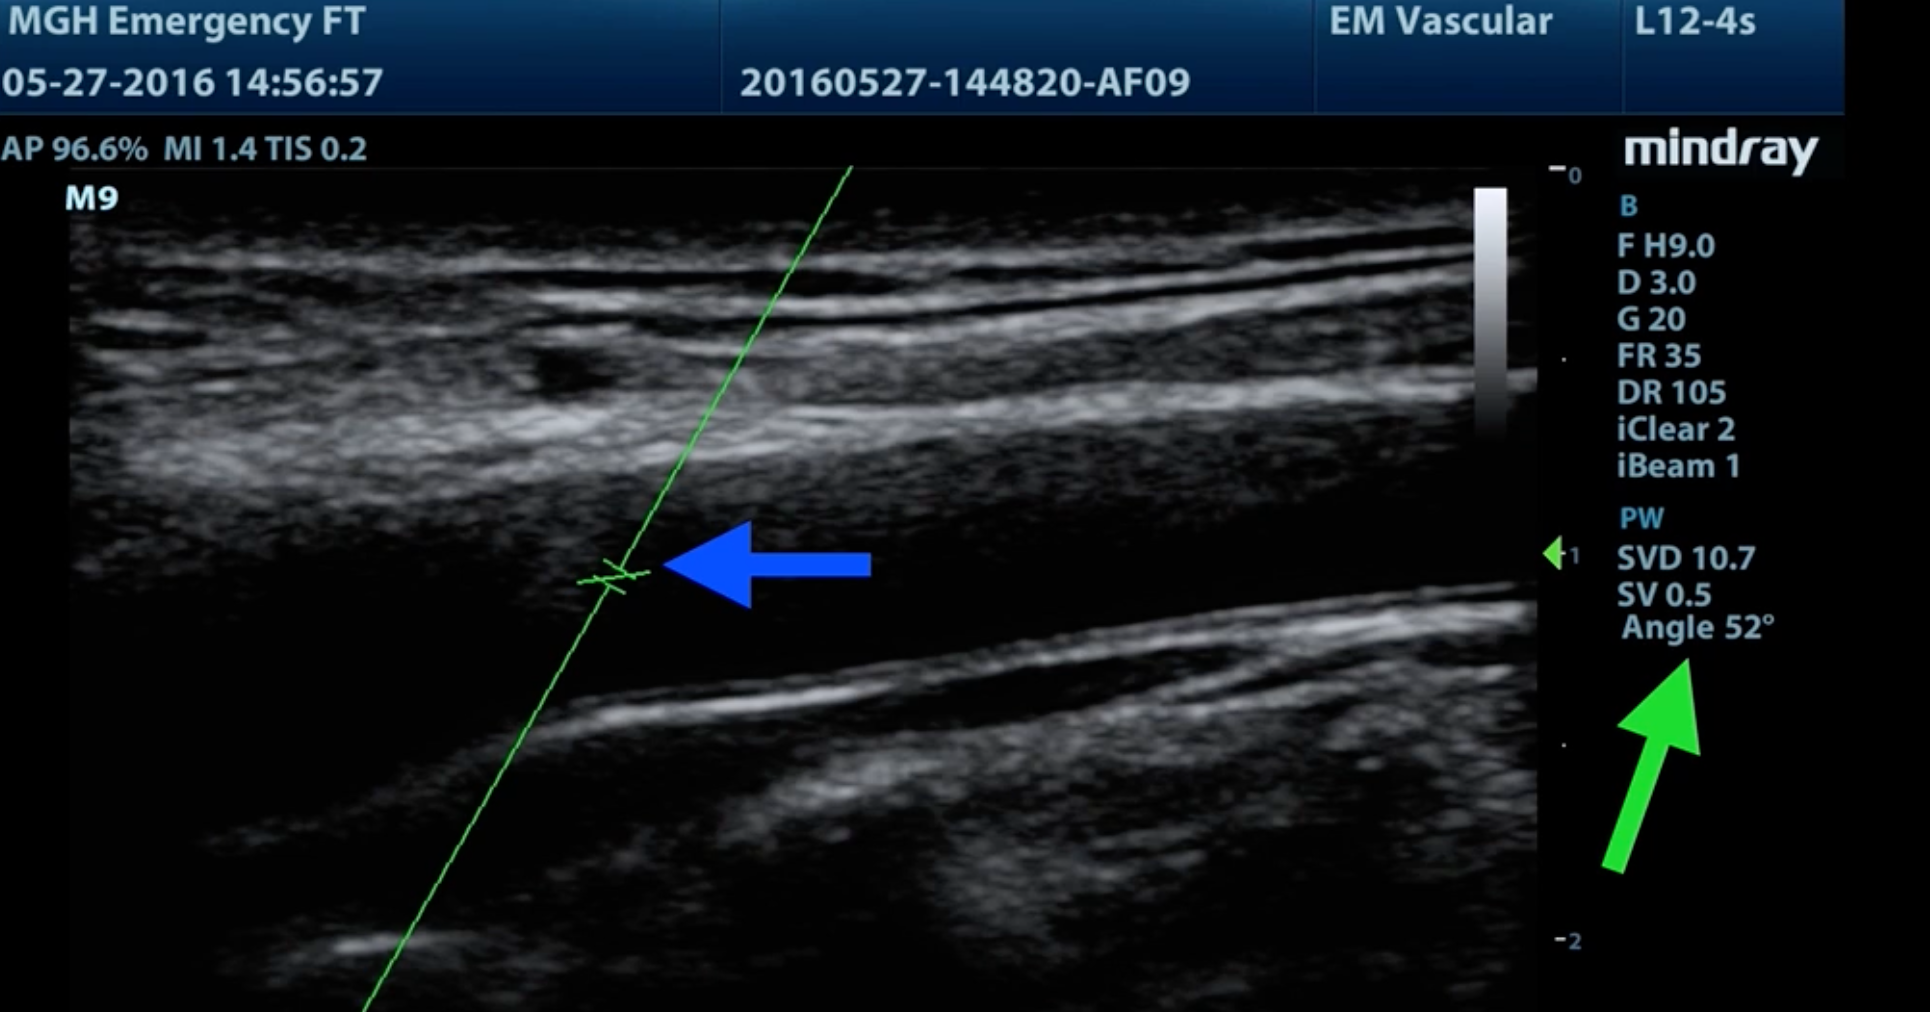
Adjust the correction angle so that it is parallel to the carotid artery, but the angle between the steering angle and the correction angle should be <60°
- If >60° should adjust the steering angle so the angle is <60°
- If >60° should adjust the steering angle so the angle is <60°
-
Activate pulse wave doppler and determine VTI
-
Calculate carotid blood flow with the formula:
- A cut off of 20% increase with passive leg raise is used
Carotid Flow Time
-
Obtain pulse wave doppler of the carotid artery (as above in carotid VTI)
-
Find the start of systole, start of the dicrotic notch and where the cycle ends
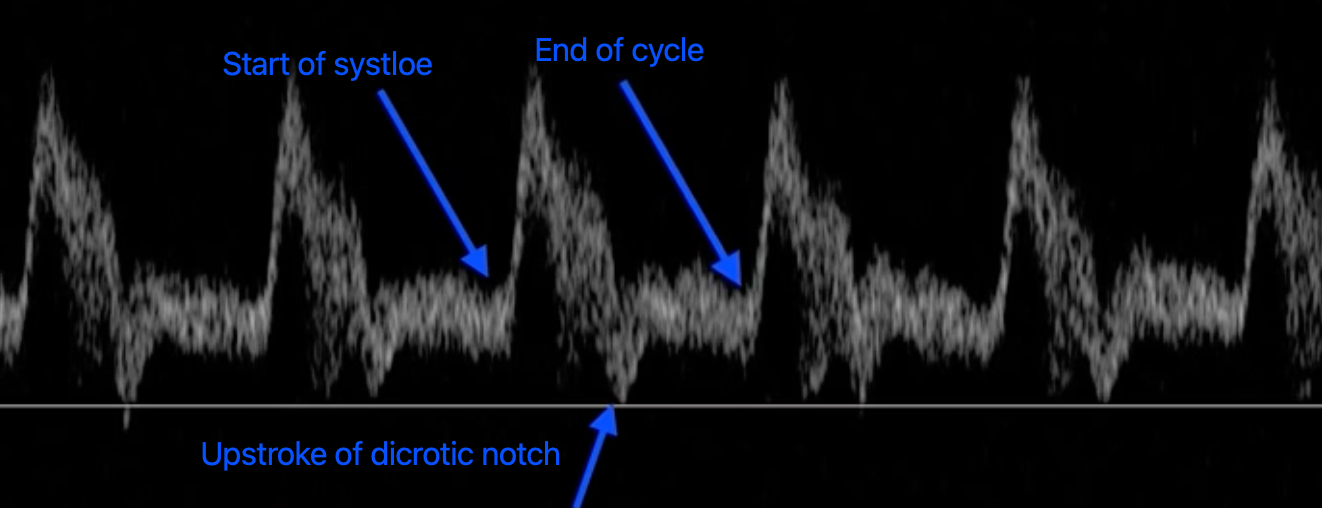

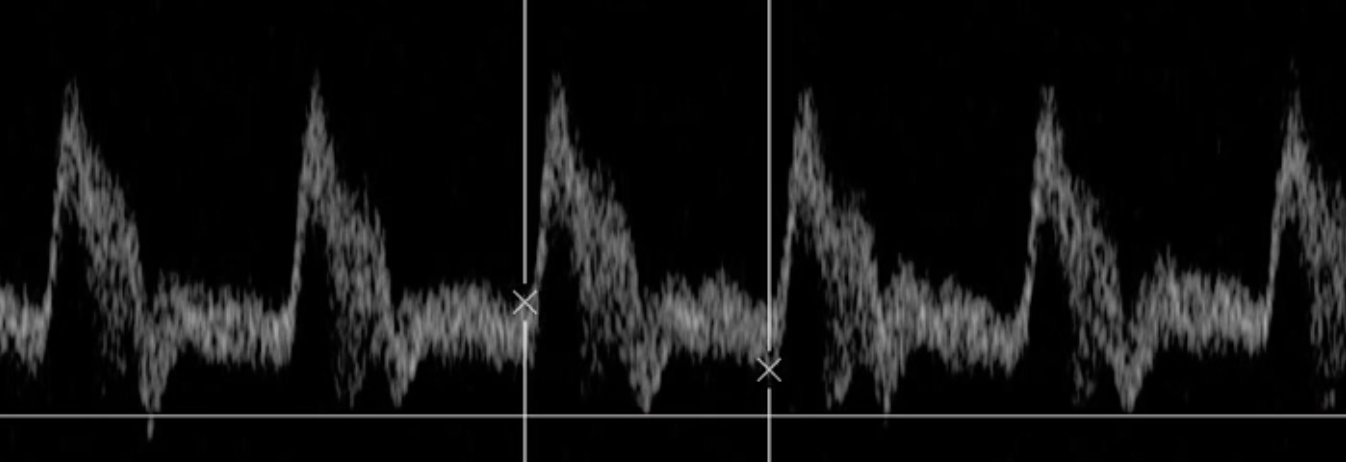
-
Calculate carotid flow time with the formula:
Respiration Variation in Carotid Peak Systolic Velocity
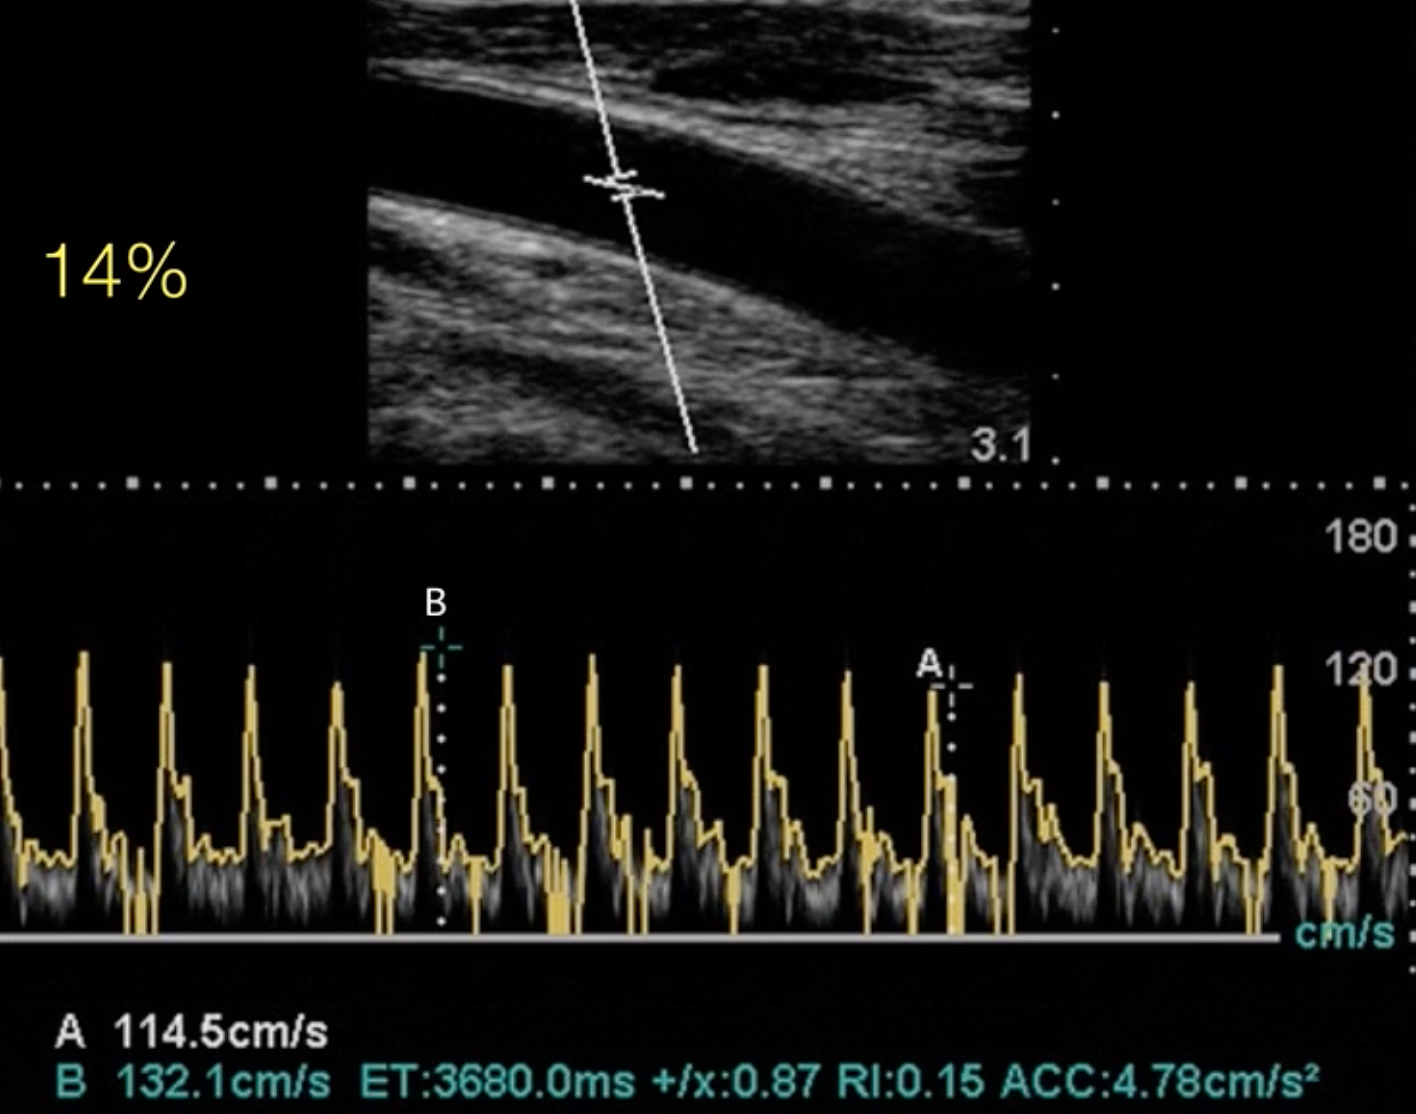
- Will need to change the sweep speed to capture more cycles with respiration and scale so that it is easier to measure the peak velocity
- Given by equation:
- A cut-off of 14% is used to predict fluid responsiveness
End Tidal
- An increase in cardiac output causes increased delivery of to the lungs thereby increasing exhaled
- A ≥ 5% with passive leg raise predicts fluid responsiveness whereas a < 2 mmHg suggests unlikely fluid responsive
- Does not work well with the micro-bolus challenge
Challenges
Passive leg raise
- Method
- Start with the patient semi-recumbent at 45°
- Raise legs to 45° while simultaneously lowering the torso to flat (or raise legs from flat if already supine)
- This transfers ~300 mL of venous blood from the lower limbs into the central circulation — an autologous, reversible fluid challenge
- Assess CO or a surrogate at baseline and at 60–90 seconds after position change (effect is transient)
- Return patient to original position — the effect is fully reversible
- Positive: ≥10% increase in cardiac output (e.g. measured with LVOT VTI, carotid VTI etc.)
- Limitations
- Cannot be performed if: raised intracranial pressure, unstable pelvic/femoral fractures, intra-abdominal hypertension (may not transfer adequate volume)
- Requires real-time CO measurement — qualitative BP change alone is insufficient
- Must measure CO response within 60–90 seconds (effect wanes)
- Advantages
- Don’t have to be in sinus rhythm and don’t have to be mechanically ventilated
Mini-Bolus & Micro Bolus
- Technique: Give 100 mL of crystalloid over 1 minute and assess CO response (via arterial PP or POCUS VTI)
- Positive: ≥6% increase in PP or VTI → likely fluid responsive
High PEEP Challenge
- Increasing PEEP can identify fluid responsiveness by identifying a decrease in MAP
- Increase PEEP from 10 to 20 cm for 1 minute while continuously measuring cardiac output and MAP
- A 8% decrease in MAP or 10% decrease in cardiac output suggests fluid responsiveness
End Expiratory Occlusion Test
- Perform an expiratory pause for 15s
- Look for a pulse pressure variation >5% which predicts fluid responsiveness
- Requires
- Mechanical ventilation at 8 mL/kg tidal volume
- A patient who is able to tolerate 15 seconds of apnoea
- Continuous cardiac output measurement
- Patients can be breathing above the ventilator and don’t have to be sinus rhythm
Sources
- Haney Mallemat The Art and Science of Fluid Responsiveness - YouTube
- How to use the LVOT VTI to determine fluid responsiveness for the critically ill patient - YouTube
- LVOT VTI Explained Clearly | Master Cardiac Output with Bedside Ultrasound POCUS | 2026 - YouTube
- Ultrasound Podcast - CAROTID VTI PASSIVE LEG RAISE FOR VOLUME RESPONSIVENESS. - YouTube
- Fluid Responsiveness • LITFL • CCC Resuscitation
- Fluid Responsiveness - Crit IQ
- Fluid resuscitation and assessment of fluid responsiveness
- Singh, A., Srinivasan, S. (2024). Understanding Heart-Lung Interactions: Concepts of Fluid Responsiveness. In: Malbrain, M.L., Wong, A., Nasa, P., Ghosh, S. (eds) Rational Use of Intravenous Fluids in Critically Ill Patients. Springer, Cham. https://doi.org/10.1007/978-3-031-42205-8_5